Driven by development and a robust real estate market, new Madison assessments show double-digit increases for commercial and residential properties with the value of the average single-family home jumping a whopping 12.4% to a record $376,900.
The last time the average home value increased by 12% was in 1994, while the $784.2 million in new construction broke the record of $750 million in 2018, City Assessor Michelle Drea said.
“It’s an indication of strength of the local and regional economy and a thriving housing market,” city finance director David Schmiedicke said.
The striking rise in housing values came despite a cautious approach to assessments over concerns of a housing market bubble due to high demand for homes and low supply, Drea said.
“Bubble markets are not based on real estate fundamentals,” she said. “They are a response to unique situations and motivations.
“As such, my office has been cautious in evaluating sales data and applying it to the market,” she said. “Practically speaking, if a sale price was dramatically different from assessed value we were thoughtful and careful in evaluating the sale, and did not apply those with a high disparity in delivering an overall trend.”
People are also reading…

The new Arden apartments, 1050 E. Washington Ave., were assessed at $27.1 million under new city property values released Friday. The city’s $784.2 million in new construction set a record.
Mayor Satya Rhodes-Conway was encouraged by the new values, but added a caveat.
“The pace of development demonstrates a thriving market,” she said. “However, the continued lack of housing supply impacts the market.”
The new assessments, based on sales and other data from 2021 and released Friday, show a 10.9% jump for all real estate, far above the 5.9% increase last year and the highest rise since an 11.3% increase in 2001.
The value of commercial property, which includes everything from multi-unit apartment buildings to hotels, office and retail buildings, leapt 14.9% and was driven largely by sales results in all those markets, Drea said. The value of commercial property rose 4.3% for 2021, down from 8.6% two years ago.

Residential assessments, including single-family homes, condos and two- and three-unit apartments, rose 12.8%, compared to 6.7% last year.
The 12.4% jump for the average single-family home doubles the increase of 6.3% last year and is well above the 4.9% and 5.7% the two previous years. In the late 2000s and early 2010s, average single-family home values dropped five straight years in the wake of the Great Recession.
The record $784.2 million in new construction far exceeds the $509 million last year, $622 million two years ago and the former record $750 million for 2018.
New values serve as the basis for tax collections.
The 10.9% rise in real estate values includes the $784.2 million in new construction and $2.73 billion in revaluations, compared to $1.6 billion in revaluations last year.
No more delays
The construction boom was likely influenced by pandemic-delayed projects moving forward, an infusion of federal infrastructure money, the city’s perennial attractiveness for investment, and the city’s geographic expansion, Drea said. The revaluations are driven by a high volume of sales, she said.

The volume of new construction is critical because tight state revenue limits restrict how much the city can increase tax collections to the amount generated by net growth, which is the value of new buildings, additions and remodeling minus the value of demolished properties.
This level of new construction value will allow an estimated levy increase of 2.4%, or about $3.8 million, for operating purposes in the 2023 budget, Schmiedicke said. Last year, growth allowed a 1.5% increase of $2.4 million.
It’s too early, however, to know what the new values may mean for individual tax bills. That will become clear in late fall when the City Council approves a budget for 2023.
The growth in property value does not necessarily mean an increase in property taxes. The growth in tax collections for all jurisdictions is limited under state law and is expected to be much lower than the increase in property values, Schmiedicke said. The higher values will result in a lower tax rate, while state aid and tax credits will also influence property tax bills, he said.
For example, the value of the average home in Madison increased by 6.4% last year, from $315,200 to $335,200, but taxes for all jurisdictions on the average home rose only 1.9%, from $7,641 to $7,817, before state tax credits were applied, Schmiedicke said. After applying state credits, taxes from all jurisdictions on that average home increased only 0.12%, he said.
‘It’s lucrative’
One type of commercial property — apartment buildings between four and 50 units — showed increases between 9.5% and 31.7%, while those with more than 50 units rose by a robust 20.5%, nearly triple last year’s percentage.

The Novo apartments, 216 S. Pinckney St., part of the massive Judge Doyle Square project Downtown, are assessed at $30.3 million. The value of large apartment buildings increased an average 20.5% under new property assessments.
“There’s a dearth of options,” Drea said. “It’s lucrative right now.”
The increases for other commercial properties — hotels, stores, offices, bars and restaurants — ran across the board, Drea said. “We had a ton of sales,” she said.
Hotels, where the property value is tied to the performance of the business, along with stores and restaurants all rose in value by about 10%, Drea said.
While hotel values did increase, they have not returned to pre-pandemic levels, she said. Last year, hotels dropped in value by 15% to 25%.
Offices lagged a bit, with values rising a still-healthy 5%, Drea said. When the COVID-19 pandemic hit and offices emptied, many predicted a drop in values. But many owners have long-term leases that protect values, at least for the near term, she said.

Changes for average single-family homes in neighborhoods ranged from a 28.8% jump from $197,900 to $254,800 in the Southeast Blooming Grove attachment on the Far East Side to a 5% rise from $791,800 to $831,700 in the Highlands-Skyland area on the Far West Side. All told, 100 of 125 geographic areas in the city showed double-digit increases, while none saw a decrease.

In addition, the city saw increases in the average value of condominiums of 11.2%, almost double that of 2021, and an increase for two-unit and three-unit apartments of 12.3% and 8.2%, roughly similar to last year’s changes.
“The relative dearth of housing inventory compared with demand is, in my view, impacting development and cost for all types of real estate providing housing,” Drea said. Meanwhile, “with telecommuting being widely available, there is a narrative that folks from the coasts are resettling here at a high pace due to a high quality of life and lower cost of living.”
Again, the city’s priciest homes were in Spring Harbor on Lake Mendota, where the average value rose 15.4% to $1.35 million. Lakeshore homes on the Isthmus rose an average 16.9% to $1.07 million to become the third area of the city to top average values over $1 million.
The most-affordable homes again were in the Burr Oaks-Lincoln School area on the South Side, where average values rose 22% to $195,400. Only one other area, Bram’s Addition on the South Side, had average homes valued under $200,000. Four years ago, five neighborhoods had values under $150,000.
The need is there
But there’s another side to rising values.
“Our assessor cautiously applied market data to moderate the impact of a very hot housing market,” Rhodes-Conway said. “This data just further demonstrates our need to build more housing. I am committed to making it easier to build housing, supporting and funding affordable housing, and increasing housing choice in every neighborhood.”

A year ago, Rhodes-Conway unveiled “Housing Forward,” a package of current and planned initiatives that represent the city’s housing agenda. It includes efforts to increase housing choices, create more low-cost housing, combat displacement and segregation, ensure seniors and others can stay in their homes, and combat homelessness.
At the end of 2021, the mayor offered a Housing Forward update that noted 22 actions taken that year, including multiple zoning revisions, increased city investments in low-cost housing, using $22 million in federal COVID-19 relief funding to help prevent evictions, and expanding shelter options for people experiencing homelessness.
City of Madison home assessments 2022
Overall real estate values in the city of Madison increased 10.9% for 2022, and the value of single-family homes rose solidly for the ninth year in a row. The average value of a home in Madison rose 12.4% to $376,900.
| Area | Avg value 2021 | Avg value 2022 | % Change |
|---|---|---|---|
| Far West | |||
| Spring Harbor-Indian Hills-Mendota Beach Heights-Thorstrand | $403,000 | $434,300 | 7.8% |
| Faircrest-University Highlands | $398,000 | $450,000 | 13.1% |
| Mohawk Park, Englewood-Old Middleton Rd-Camelot | $297,600 | $325,400 | 9.3% |
| Highlands-Skyline | $791,800 | $831,700 | 5.0% |
| Parkwood Hills | $437,400 | $487,800 | 11.5% |
| Walnut Grove/Sauk Creek | $410,100 | $452,100 | 10.2% |
| Glen Oak Hills-Crestwood-Merrill Crest | $299,600 | $337,500 | 12.7% |
| Junction Ridge/Sauk Heights/Willows | $446,300 | $490,700 | 9.9% |
| Oakbridge | $295,500 | $333,300 | 12.8% |
| Saukborough-Woodland Hills | $455,300 | $511,600 | 12.4% |
| Wexford Village-Sawmill-Longmeadow | $379,700 | $430,200 | 13.3% |
| Blackhawk/Greystone | $683,600 | $748,000 | 9.4% |
| Cardinal Glen/Birchwood/1000 Oaks | $385,100 | $421,000 | 9.3% |
| Tamarack | $292,200 | $316,100 | 8.2% |
| South West | |||
| Meadowood | $259,600 | $286,800 | 10.5% |
| Orchard Ridge | $305,600 | $349,300 | 14.3% |
| Muir Field West | $303,500 | $341,300 | 12.5% |
| Highland Village/West Towne Area | $271,700 | $307,800 | 13.3% |
| Green Tree | $321,400 | $370,500 | 15.3% |
| Westview Hills | $495,600 | $542,100 | 9.4% |
| High Point Estates | $513,800 | $571,800 | 11.3% |
| Meadowood West | $275,600 | $310,100 | 12.5% |
| Heather Downs-Park Ridge Heights | $253,800 | $295,500 | 16.4% |
| Putnam-McKee | $297,200 | $342,900 | 15.4% |
| Valley Ridge/Mid Town Commons | $335,000 | $385,300 | 15.0% |
| Fieldstone | $298,800 | $333,300 | 11.5% |
| Hawks Landing | $623,300 | $674,500 | 8.2% |
| Stone Crest Estate/Hawks Creek | $383,300 | $423,100 | 10.4% |
| Hawks Woods | $374,300 | $408,700 | 9.2% |
| Nesbitt Valley | $325,800 | $359,500 | 10.3% |
| Ice Age Falls | $366,400 | $419,400 | 14.5% |
| Country Grove/Ice Age Ridge | $383,100 | $427,900 | 11.7% |
| Linden Park/Pine Hill Farms/Sugar Maple/Hawks Crossing | $394,500 | $431,400 | 9.4% |
| Newbury Heights | $318,300 | $366,700 | 15.2% |
| Hawks Meadow/Hawks Ridge/Hawks Valley | $483,500 | $512,700 | 6.0% |
| Acacia Ridge* | $348,800 | $375,000 | 7.5% |
| *New subdivision and new construction. | |||
| Near West | |||
| Hill Farms | $405,300 | $459,600 | 13.4% |
| Segoe-Mineral Point Road (Lincoln Hills) | $307,300 | $346,700 | 12.8% |
| Nakoma | $578,300 | $640,100 | 10.7% |
| Westmorland | $404,300 | $429,900 | 6.3% |
| Odana-Midvale Heights-Tokay | $343,600 | $389,200 | 13.3% |
| Summit Woods | $298,600 | $325,400 | 9.0% |
| Midvale Heights | $359,700 | $396,200 | 10.1% |
| Midvale School-Westmorland | $370,300 | $441,800 | 19.3% |
| Findlay Park-Quarrytown | $342,000 | $362,400 | 6.0% |
| Midvale Heights-Odana | $372,500 | $422,100 | 13.3% |
| Sunset Hills | $548,000 | $640,600 | 16.9% |
| West Beltline-Seminole Highway | $221,400 | $253,200 | 14.4% |
| Sunset Village-Hilldale | $343,300 | $380,200 | 10.7% |
| Sunset Village | $375,800 | $402,200 | 7.0% |
| Sunset Woods-Forest Hills | $368,500 | $394,000 | 6.9% |
| West Central | |||
| Dudgeon-Monroe | $422,700 | $472,800 | 11.9% |
| Westlawn-Randall School (West High) | $525,000 | $590,300 | 12.4% |
| Vilas-Longfellow School | $368,600 | $410,600 | 11.4% |
| University Area | $370,900 | $424,100 | 14.3% |
| Langdon Area | $417,400 | $459,100 | 10.0% |
| Near West (Square) | $341,900 | $376,300 | 10.1% |
| Near East (Square) | $325,100 | $359,200 | 10.5% |
| University/Breese Terrace | $474,100 | $519,100 | 9.5% |
| West High-Hoyt Park | $478,500 | $537,000 | 12.2% |
| University Heights | $684,000 | $743,500 | 8.7% |
| Brittingham Park | $278,300 | $316,600 | 13.8% |
| Vilas-Edgewood Avenue | $581,200 | $648,900 | 11.6% |
| Near South | |||
| Waunona | $282,600 | $321,200 | 13.7% |
| Bay Creek | $300,600 | $331,100 | 10.1% |
| Burr Oaks-Lincoln School | $160,100 | $195,400 | 22.0% |
| Bram’s Addition | $175,100 | $198,900 | 13.6% |
| Far South | |||
| Arbor Hills-South Beltline | $357,900 | $389,600 | 8.9% |
| Rimrock Heights-Moorland Road | $255,800 | $289,400 | 13.1% |
| East Central | |||
| Lapham School-Breese Stevens (Square) | $318,400 | $349,700 | 9.8% |
| Wil-Mar/Orton Park | $432,800 | $474,100 | 9.5% |
| Tenney Park | $434,700 | $476,600 | 9.6% |
| East High | $247,500 | $293,100 | 18.4% |
| Atwood-Winnebago | $297,600 | $328,000 | 10.2% |
| Fair Oaks-Worthington Park | $195,500 | $221,600 | 13.4% |
| Northgate-Aberg Avenue | $198,700 | $228,800 | 15.1% |
| Elmside-Oakridge | $425,500 | $490,900 | 15.4% |
| Eastland-North Gardens | $210,000 | $249,400 | 18.8% |
| Near East | |||
| Highwood-Glendale | $256,700 | $301,700 | 17.5% |
| Glendale | $241,100 | $280,600 | 16.4% |
| Lake Edge | $220,600 | $253,000 | 14.7% |
| Olbrich | $213,900 | $245,000 | 14.5% |
| Eastmorland | $238,900 | $271,900 | 13.8% |
| Olbrich Park-Cottage Grove Road | $251,000 | $289,800 | 15.5% |
| Far East | |||
| East Broadway | $202,300 | $239,800 | 18.5% |
| Elvehjem-Acewood | $249,100 | $285,600 | 14.7% |
| Elvehjem-Buckeye-Droster | $269,600 | $303,100 | 12.4% |
| Rolling Meadows | $243,900 | $275,400 | 12.9% |
| Rustic Ridge-East Ridge | $278,200 | $314,200 | 12.9% |
| Milwaukee Street I90-94 | $250,800 | $284,400 | 13.4% |
| Heritage Heights | $279,000 | $309,100 | 10.8% |
| Richmond Hill | $388,700 | $456,500 | 17.4% |
| Mira Loma | $269,800 | $305,700 | 13.3% |
| Grandview Commons | $318,100 | $354,800 | 11.5% |
| Twin Oaks-Liberty Pl-Owl Crk | $275,200 | $313,700 | 14.0% |
| Door Creek/Reston Heights | $305,700 | $345,600 | 13.1% |
| Eastlawn/Covered Bridge/Rustic Acres | $310,100 | $350,600 | 13.1% |
| Southeast Blooming Grove Attachment | $197,900 | $254,800 | 28.8% |
| Lost Creek | $282,400 | $331,200 | 17.3% |
| Siggel Grove & Quinn Ranch | $309,800 | $362,300 | 16.9% |
| Secret Places @ Siggelkow Preserve | $350,000 | $407,100 | 16.3% |
| North East | |||
| East Washington Avenue-Stoughton Rd-Commercial Avenue | $206,100 | $231,200 | 12.2% |
| Whitetail Ridge | $243,800 | $290,600 | 19.2% |
| Holiday Bluff | $262,300 | $292,500 | 11.5% |
| Berkeley | $196,100 | $227,500 | 16.0% |
| Prentice Prairie-Ridgewood | $287,900 | $321,500 | 11.7% |
| Village at Autumn Lake | $316,100 | $360,400 | 14.0% |
| Parkway Village | $279,600 | $307,000 | 9.8% |
| Woods Farm | $385,700 | $425,300 | 10.3% |
| Near North | |||
| Patio Gardens-Lakeview Heights | $230,400 | $268,500 | 16.5% |
| Northport-Sherman Village | $220,500 | $252,300 | 14.4% |
| Cherokee | $361,900 | $426,500 | 17.9% |
| Lerdahl Park | $270,000 | $291,800 | 8.1% |
| North Lake Mendota | $299,800 | $346,300 | 15.5% |
| Sherman School | $201,800 | $230,300 | 14.1% |
| Brentwood Village-Sheridan Triangle | $235,600 | $274,400 | 16.5% |
| Nobel Park-Mendota Hills | $207,000 | $237,000 | 14.5% |
| Lake Shore | |||
| Waunona | $741,400 | $883,200 | 19.1% |
| Woodward | $1,011,200 | $1,182,800 | 17.0% |
| Spring Harbor | $1,170,700 | $1,351,300 | 15.4% |
| Isthmus | $920,700 | $1,076,000 | 16.9% |
| Citywide | $335,200 | $376,900 | 12.4% |
39 Madison-area restaurant, bar and coffee shop openings in 2021, including more on the way
Stadium Takeout

Don Woods opened Stadium Takeout in early October, next to his barber shop, Faded Club, on Monroe Street, where Lorraine’s, and before that, New Orleans Take-Out, were.
The Harvey House

Joe Papach and Shaina Robbins Papach opened this modern-day supper club in July, tucked into the Madison Train Depot, behind Motorless Motion Bicycles on West Washington Avenue.
Delicacies of Asia

Ting Cai Zhou opened this State Street counter-service restaurant where Lotsa Stone Fired Pizza was.
Kettle Black Kitchen

Brian and Alicia Hamilton opened this intimate, full-service 30-seat restaurant on Monroe Street in August across from Trader Joe’s where Joon, Burgrito and Double S BBQ were.
Patricia’s Taqueria & Groceries

Patricia Sánchez and Adrian Serrato opened this restaurant and store in the former Farm Tavern, south of the Beltline. In November, they opened a second one in Lakewood Plaza Shopping Center at Sherman and Commercial avenues.
Forage Kitchen Middleton

Henry Aschauer opened a fourth of his healthy fast-food restaurants in November on Old Sauk Road in a former Cousins Subs shop.
Portillo’s West

Madison’s second Portillo’s hot dog restaurant with a three-lane drive-thru opened at West Towne Mall where a Sears Auto Center was.
Grace Coffee Co.

Carlos Falcon opened his fifth and sixth coffee shops, one on Park Street in the Peloton Residences apartments, the other in Verona, next to the new high school.
Sunroom Cafe
Juan Montiel and his father, Euler Montiel, bought this second-floor, State Street favorite last summer and added some of their native Venezuelan specialties.
Raising Cane’s Chicken Fingers

This Louisiana-based chain, focused on chicken strips, opened in June next to Colectivo Coffee on State Street.
Ancora Cafe + Bakery

The cafe opened in February in Maple Bluff where Manna Café was. It joins Tori Gerding’s King Street Ancora and her Ancora on University Avenue.
Mercies Coffee

Mallory Orr, who briefly worked at the 20-year-old Cool Beans, near East Towne Mall, opened her new shop in its place in December.
Poke Bar

Evelyn Jian opened her small Middleton counter-service restaurant in early May.
Peanut Butter & Jelly Deli

Mike Hottinger opened this counter-service shop in mid-September on State Street in what had been Frutta Bowls.
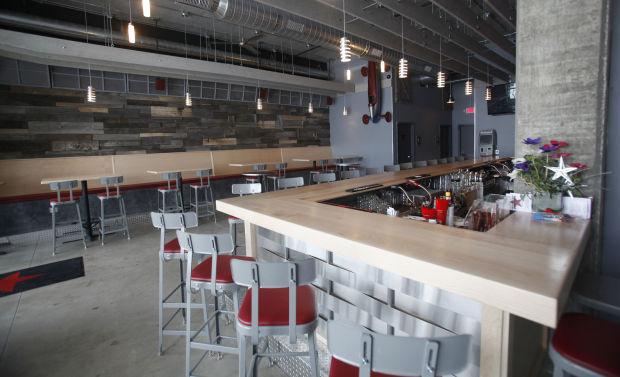
Blind Shot Golf & Social Club
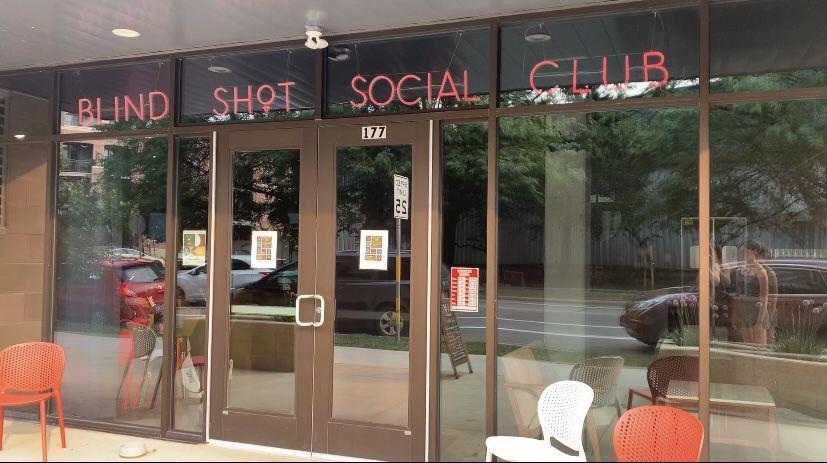
Brent Mann and Michelle Duvall opened their indoor golf club, bar and restaurant in June on Fair Oaks Avenue on the ground level of the mixed-use Garver Point Apartments.
Mount Vernon Tap

Walter Heinrich and Jennie Corey-Heinrich took over the popular bar Marcine’s in Mount Vernon and renamed it. They promised to keep almost everything the same.
Granny’s Kitchen

Tyrone Austin and Ondray Sellers, with help from Mary Bridges, opened the takeout restaurant in February in the back of a Citgo gas station on Northport Drive.
Takarajima Sushi

Jeannie Ni opened this sushi spot in April on Cottage Grove Road where Good Food Low Carb Café was.
Takara Sushi Station

Jeannie Ni opened her conveyor-belt sushi restaurant in August on Whitney Way where, for 14 years, she co-owned Takara Japanese Restaurant.
Marquette Hotel Café

James Montgomery opened the cafe mid-May in his three-year-old hotel on South Baldwin Street off Williamson Street.
Bombay Fast Café

Madhuri Ranade opened her food cart in June on Library Mall, and sells four items.
Good News Ice Cream
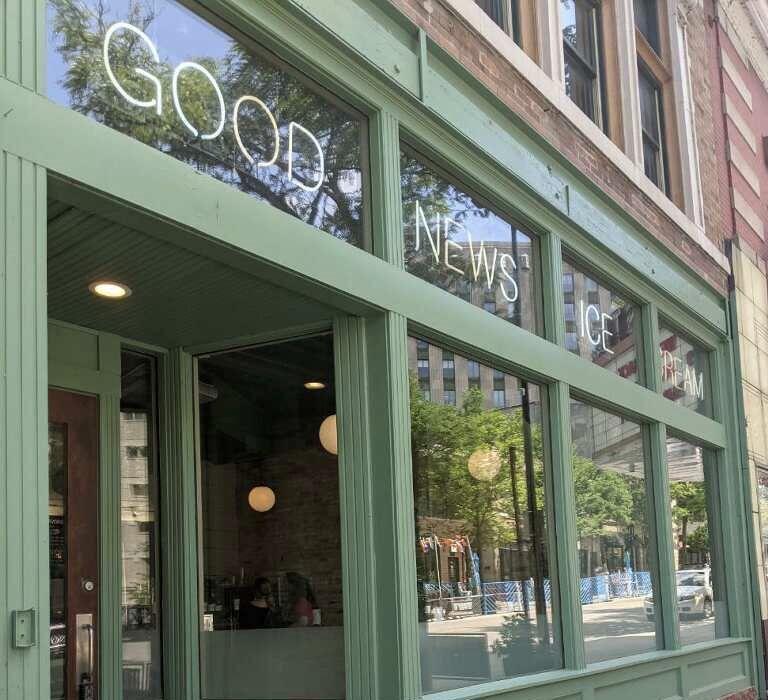
Andy Haker, who owns Madison’s on King Street, turned the restaurant-bar’s party room into an artisan ice cream and coffee shop.
Oz by Oz

Sam Parker, Ryan Huber and Brian Bartels, who also own neighboring Settle Down Tavern, opened the bar in October on King Street.
Leopold’s Books Bar Caffe

Sam Brown opened a combination bookstore, bar and café in July next to the Regent Street Rocky’s, where Greenbush Bakery was.
Taco Local

David Rodriguez opened Taco Local in April on Williamson Street where Underground Butcher was.
Dive Inn
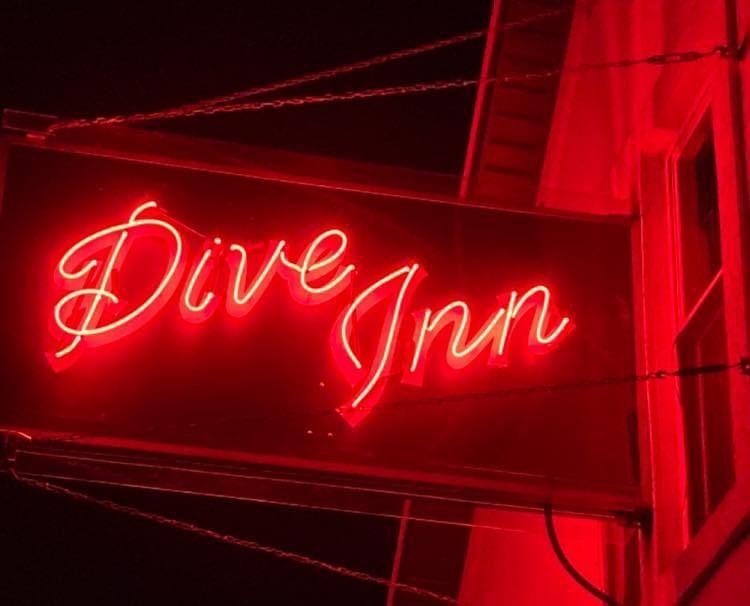
Ryan Ramig and Josh Wacker opened a bar on Cottage Grove Road where JoBeck’s Bar was.
Hone

Michael Parks opened this eclectic restaurant in the former Forequarter space on East Johnson Street.
City Barbeque

This Ohio-based chain opened its first Wisconsin location in March at the corner of Gammon and Mineral Point roads.
Rising Sons Verona

Sinarack “Be” Macvilay opened a third Rising Sons Laotian-Thai restaurant on West Verona Avenue, where Jordandal Cookhouse was.
Camp Beef Butter BBQ

Patrick Riha, who owns Beef Butter BBQ restaurant on the North Side, opened this seasonal outdoor spot in the town of Westport.
Buck & Honey’s Waunakee

The restaurant, in the former Boston’s Pizza Restaurant & Sports Bar, had a soft opening in December 2020, but is being counted as a 2021 opening.
Forma

Nathan Mergen, who owns the restaurant/bar 107 State at that address, expanded next door last spring into the former Shoo store, for a private dining room and “urban art gallery.”
Dark Horse ArtBar
Patrick DePula of Salvatore’s Tomato Pies on East Washington Avenue took over the space next door that used to be Star Bar for an art gallery, bar, and performance art and music venue.
Coming soon: Jacknife

Jacknife will be a fast-casual restaurant on East Washington Avenue from the owners of the sushi favorite RED.
Coming soon: Chasers 2.0

Chasers Bar & Grille was chased out of its West Gorham Street home because of redevelopment, but Chasers 2.0 is opening in the old Nomad spot a block away.
Coming Soon: East Johnson Family Restaurant

East Johnson Family Restaurant, an upscale diner from the couple behind Johnson Public House.
Coming Soon: Driftless Social

Driftless Social in Mount Horeb, a supper club in the old Schubert’s diner and bakery from Matt and Tim Schmock, two grandsons of the founders of Smoky’s Club in Madison.
Coming Soon: Mio Fratello
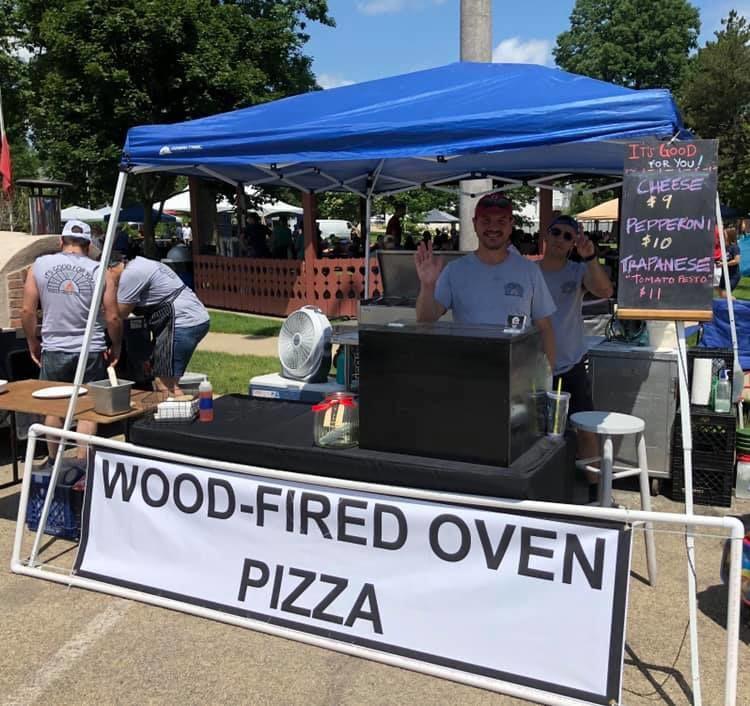
Mio Fratello, a pizza place on the North Side from Alessandro Monachello and Chris Guglielmo. The partners have tweaked their business model to do catering and pop-up events. They’ve been selling their wood-fired pizza at the North Side Farmers’ Market and at festivals and private events.
Coming soon: Red Rooster

Red Rooster in the former Knuckle Down Saloon from Jesse Steinberg, Paul Schwoerer, Tim Payne and Dan Resnick, members of Madtown Mannish Boys, a local blues band.